ARPA
PPC
Navigational
lines and maps
This is a facility whereby electronic lines can be
drawn on the screen. The position,
length and orientation of the lines can be adjusted, thus making it possible to
produce parallel indexing lines and to draw navigational limits in channels,
traffic separation schemes, poor-response coastlines etc. It is also possible to indicate points of
interest such as isolated rocks and buoys with symbols.
These allow the observer to prepare and store the
pattern at a convenient time when passage planning and subsequently to recall
it when required. It is possible to move
the map around the screen in order to align it with displayed radar echoes. The
facility is generally used in association with automatic ground-stabilization.
The
potential point of collision
The potential point of collision (PPC) is that point
toward which own ship should steer at her present speed (assuming that the
target does not manoeuvre) in order for a collision to occur.
The reason for displaying the PPC’s
is that they assist in developing a collision avoidance strategy by showing the
observer, at a glance, the courses, which are completely unacceptable, because
they intersect a collision point.
They do not give any indication of miss distance (other than in the zero case) and any attempt to
extrapolate the clearing distance either side of the point is dangerous. A safe course is one which, among other
things, results in passing at a safe distance, which implies knowledge of
clearing distance.
Safe and effective use of PPC does depend upon a
thorough understanding of the factors, which affect their location and
movement.
The concept
of collision points
When two ships are in the same area of sea, it is
always possible for them to collide. The
point(s) at which collision can occur may be defined and depends upon:
The speed ratio of the two ships,
The position of the two
ships.
Considering any two ships, usually one is moving
faster than the other; the possibility that one is at exactly the same speed as
the other and will maintain that ratio for any period of time is quite
unlikely, though it may also happen.
The ship which is the faster of the two will always
see displayed one and only one collision point, since it can pursue the target
if necessary.
The ship, which is the slower of the two, may see
displayed two collision points, both of which must be on the target track.
One exists where the slow ship heads toward the target
and intercepts it, while another exists where the slow ship heads away from the
target but is struck by it.
Alternately there may be no way for the slower ship to
collide with the faster (even though the faster may collide with the slower)
because it is just not fast enough to reach the target
Note A critical
in-between case of one collision point exists where the slow ship can just
reach the track of the fast ship.
It is important to realize that collision points
exist, whether an actual collision threat exists or not. The only significance is that in the event of
an actual collision threat, the collision points are the same for both
ships.
The behaviour of the
collision point when the target ship’s speed changes
If the speed
ratio is infinitely large, e.g. when the target is stationary, then obviously
the collision point is at the position of the target. If the observing ship maintains speed while
the target begins to increase speed, the collision point will begin to move
along the target track. When the target
speed has increased to that of the observing ship, the secondary collision
point will appear at infinity. Further
increase of the target speed will move the primary and secondary collision
points toward each other (not necessarily by equal amounts); eventually, own
speed in comparison to target speed may be so slow that the two points will
merge and then disappear.
The behaviour of the
collision point when the target changes course
If the two ships have the same speed, the collision
point moves on a locus, which is the perpendicular bisector of the line joining
the two ships. The greater the aspect,
the farther away the collision point will be. Theoretically, the limiting
aspect in this case is 90˚, but then the collision point would be at
infinity and hence an aspect of some 85˚ plus is considered the practical
limit.
For a
slower observing ship
When the observing ship is slower than the target, two
collision points exist. And they are seen to be on the circumference of a
circle whose centre and radius are dependent of the
speed ratio; the circle is always on the ‘observing ship’ side of the unity
speed ratio locus. A limiting aspect can
be defined which is also dependent on the speed ratio. A slower own ship will mean that a target will
have a smaller limiting aspect angle.
Aspects greater than the limit pose no hazard since
the observing ship can never catch up with the target.
When the observing ship is the faster, the circle of
collision points lies on the target side of the equal-speed locus. As the aspect increases, the collision point
moves farther away from the observing ship.
There is no limiting aspect and collision is always possible.
This is effectively a limiting course for the
observing ship, if the actual heading is to the remote side of this line, all
collision points appear on the one bow.
If own heading is inside this limiting direction, the collision point
will move across the heading marker as the target changes aspect.
Example:
Own Ship on course of 000° (T) and at a speed of 10
knots, observes as follows:
Time Bearing Range
0923 037° (T) 10.3 NM
0929 036°(T) 8.5 NM
0935 034°(T) 6.7 NM
Find the PPC.
2 1
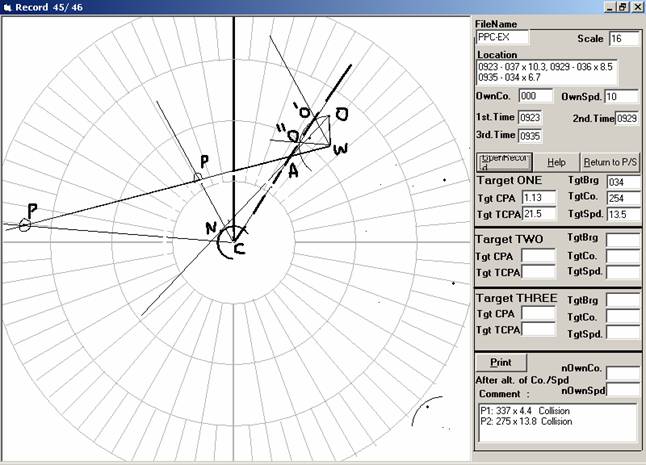
If vessel alters course to port (O’) then there would
be collision at point P1.
And if she alters course more to port nearly same as
that of the target then too there would be collision at P2
How to draw:
Draw the normal plot. Extend the line WA to beyond the
plot.
From centre C, draw a line to A and extend it beyond
the plot.
Draw an arc – centred on W,
with radius as WO so as to cut the new line CA extended.
Name the points of intersection O’ and O’’.
Join WO’ and WO’’. These are
the new course to steer for collision to occur.
Draw parallel line to WO’
and WO’’ from C, so as to cut the extended line WA.
Measure off the Bearing and distance of points P1 and
P2 from C.
These are the two PPCs.
The
predicted area of danger (PAD)
The shortcomings of collision points can be listed as follows:
Inaccuracies in data acquisition are likely to
displace the points.
No account is taken of the dimensions of the ships
involved.
They offer no quantitative indication of miss
distance, which is the essential data required for collision avoidance.
The logical development is to construct, around the
PPC, a plane figure which is associated with a chosen passing distance and in
the calculation of which due margin of safety can be allowed for the effects of
data inaccuracies and the physical dimensions of the vessels involved.
The area within the figure is to be avoided to achieve
at least the chosen passing distance and is referred to as a predicted area of danger
or PAD. It is essential that the user has a thorough understanding of the
principles underlying the presentation with particular reference to the
location, movement, shape and change of shape of the PAD. As will be seen from the following explanation,
this is not a simple subject.
In the case of the collision point there is a course
which intercepts the target’s track at the given speed ratio, whereas in the
predicted area of danger there are generally two intersection points. One of these is where the observing ship will
pass ahead of the target and the other where the observing ship will pass
astern of the target. The angle
subtended by these two limiting courses will depend upon:
The speed ratio.
The position of the target.
The aspect of the target.
As shown in the case of the collision point, a faster
observing ship must always generate a single cross-ahead and cross-astern
position. A slower observing ship
produces much more complex possibilities and, depending on the three variables
noted above, these might include:
Two cross ahead and two cross-astern points.
One cross ahead and two
cross-astern points.
Two cross-astern points.
No hazard.
In the case of the single or primary collision point,
the position at which the observing ship will cross ahead of the target is
always farther from the target than the collision point, while the cross-astern
point is always nearer to the target.
In the case of a slower observing ship, where there is
a secondary collision point, the second cross-ahead position is nearer to the
target and the associated cross-astern position more remote from it.
To indicate limits within the ‘cross-ahead/cross
astern’ arc, it is necessary to draw a bar parallel to the target’s track and
at the intended miss-distance closer to the observing ship’s position.
The limits defined by the arc and the bar are such
that, if the observing ship were to cross those limits, then it would be at a
less distance than the desired miss-distance from the target.
The PAD in practice
In order to produce an acceptable system for practical
operation, these limits are normally encapsulated by a symmetrical figure such
as an ellipse or a hexagon.
In the case of the ellipse, the major axis is equal to
the difference between the cross-ahead and cross-astern distances as measured
from the target, while the minor axis is equal to twice the intended
miss-distance. In the case of the
hexagon, it is drawn from a rectangle and two isosceles triangles. The base of the triangle is always twice the
miss-distance and the vertical height is one quarter of the distance. It should
be noted that the collision point is not necessarily at the centre of either of
the traditional figures.
In many cases the stylized figures do not follow the
limits exactly, but any bias is on the safe side.
Changes in the shape of the PAD
Due to the lack of symmetry in the geometry, which
generates the area, the cross-ahead and cross-astern positions do not move
symmetrically about the collision point when the miss-distance is changed. The cross ahead position usually moves more
markedly than the cross-astern position, showing the movement of the two
collision points, where the primary movement is much slower than the
secondary. The overall result is an
asymmetrical growth of the area with the cross-ahead position moving rapidly
away from the collision point.
The movement of the PAD
As in the case of the collision point, when a danger
area is violated by the heading marker the danger area will continue to move
down the heading marker with the cross-ahead and cross-astern points on
opposite bows. The shape of the danger
area may change but it will never move off the heading marker. In the case of a slower ship, where either of
the two predicted areas is violated, the other will move in toward the target
and eventually merge with the one on the heading marker.
In the limiting case where the observing ship’s
heading marker just touches the limit of either of the predicted areas of
danger, the limit will remain in contact with the heading marker, although the
shape of the area may change considerably.
In the non-collision case where the heading marker
does not violate one of the danger areas, the areas themselves will move across
the screen, changing in shape and position.
In the case of the dual areas of danger, although the movement will
generally be the same as that shown for the dual collision points, a special
case can arise when two danger areas may merge.
This special case indicates the possibility of two cross- astern
positions existing but no cross-ahead position.
It is also possible that cross- astern positions may exist and an area
of danger be drawn, which does not embrace an actual collision point.
Special cases
In some cases, for example, an end on encounter, a
cross-ahead and cross-astern position is not valid. In this context it is necessary to consider a
pass-to-port and pass-to-starboard as defining the limits of the miss
distance. In the practical case, this
results in the generation of a circle about the target’s position.