| Sailings | Chart Work Exercises | Information from Charts | Tides | Sextant |
Terrestrial Navigation
Charts
Charts are graphic representations of areas of the
earth for use in navigation.
Nautical charts depict features of particular interest
to the navigator.
Stereographic and orthographic projections date from
the 2nd century BC.
In 1569 Gerardus Mercator
published a chart using the mathematical principle, which now bears his name.
Sailing directions or pilots have existed since at
least the 6th century BC. Modern pilots and sailing directions are based on
extensive data collection and compilation efforts begun by Matthew Fontaine
Maury beginning in 1842.
PROJECTIONS:
Classification of projections depends on whether the
projection is centered on the equator (equatorial), a pole (polar), or some
point or line between (oblique). The name of a projection indicates its type
and its principal features.
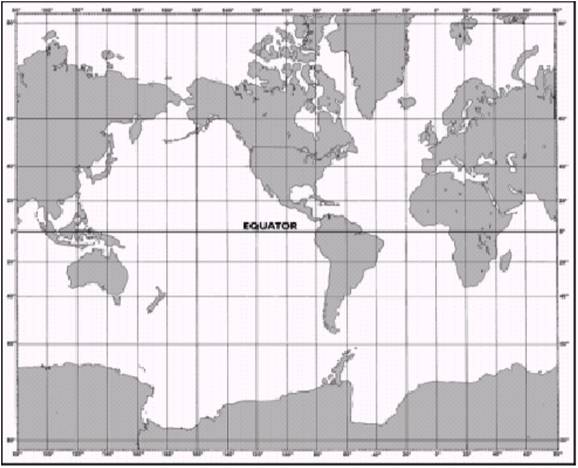
For mariners the most frequently used charting system
is the Mercator projection, classified as a cylindrical projection upon a
plane, the cylinder tangent along the equator.
Similarly, a projection based upon a cylinder tangent
along a meridian is called transverse (or inverse) Mercator or transverse (or
inverse) orthomorphic.
The Mercator is the most common projection used in
maritime navigation, primarily because rhumb lines plot as straight lines.
In a simple conic projection, points on the surface of
the earth are transferred to a tangent cone. In the Lambert conformal
projection, the cone intersects the earth (a secant cone) at two small circles.
In a polyconic projection, a series of tangent cones
is used.
If the origin of the projecting rays is the center of
the earth, a gnomonic projection results; if it is the point opposite the
plane’s point of tangency, a stereographic projection; and if at infinity (the
projecting lines being parallel to each other), an orthographic projection. The
gnomonic, stereographic, and orthographic are perspective projections.
Mercator Projection
In the Mercator projection the parallels can be
derived mathematically as well as projected geometrically. Its distinguishing
feature is that both the meridians and parallels are expanded at the same ratio
with increased latitude.
The expansion is equal to the secant of the latitude,
with a small correction for the ellipticity of the
earth. Since the secant of 90˚ is infinity, the projection cannot
include the poles.
Since the projection is conformal, expansion is the
same in all directions and angles are correctly shown.
Rhumb lines appear as straight lines, the directions
of which can be measured directly on the chart. Distances can also be measured
directly if the spread of latitude is small. Great circles, except meridians
and the equator, appear as curved lines concave to the equator.
Small areas appear in their correct shape but of
increased size unless they are near the equator.
Meridional Parts
Earth as a
Sphere
At the equator a degree of longitude is approximately
equal in length to a degree of latitude.
As the distance from the equator increases, degrees of
latitude remain approximately the same, while degrees of longitude become
progressively shorter.
Earth
spread out as a Flat Mercator Chart
Since degrees of longitude appear everywhere the same
length in the Mercator projection, it is necessary to increase the length of
the meridians if the expansion is to be equal in all directions.
Thus, to maintain the correct proportions between
degrees of latitude and degrees of longitude, the degrees of latitude must be
progressively longer as the distance from the equator increases.
The length of a meridian, increased between the
equator and any given latitude, expressed in minutes of arc at the equator as a
unit, constitutes the number of meridional parts (MerPart) corresponding to that latitude. Meridional parts,
given in the Nautical Tables for every minute of latitude from the equator to
the pole, make it possible to construct a Mercator chart and to solve problems
in Mercator sailing.
Gnomonic
Projection
If a plane is tangent to the earth, and points are
projected geometrically from the center of the earth, the result is a gnomonic
projection.
The distance scale, however, changes rapidly. The
projection is neither conformal nor equal area. Distortion is so great that
shapes, as well as distances and areas, are very poorly represented, except
near the point of tangency.
The usefulness of this projection rests upon the fact
that any great circle appears on the map as a straight line, giving charts made
on this projection the common name great-circle charts.
Gnomonic charts are most often used for planning the
great-circle track between points. Points along the determined track are then
transferred to a Mercator projection.
The great circle is then followed by following the
rhumb lines from one point to the next.
ECDIS - A graticule is the network of latitude and longitude lines
laid out in accordance with the principles of any projection.
SCALE:
Types Of Scales
The scale of a chart is the ratio of a given distance
on the chart to the actual distance, which it represents on the earth. It may
be expressed in various ways. The most common are:
1. A simple ratio or fraction, known as the
representative fraction. For example, 1:80,000 or 1/80,000 means that one unit
(such as a meter) on the chart represents 80,000 of the same unit on the
surface of the earth. This scale is sometimes called the natural or fractional
scale.
A statement that a given
distance on the earth equals a given measure on the chart, or vice versa. For
example, “30 miles to the inch” means that 1 inch on the chart represents 30
miles of the earth’s surface. Similarly, “2 inches to a mile” indicates that 2
inches on the chart represent 1 mile on the earth. This is some-times called
the numerical scale.
A line or bar called a graphic scale may be drawn at a convenient place on the chart and subdivided into nautical miles, meters, etc. All charts vary somewhat in scale from point to point, and in some projections the scale is not the same in all directions about a single point. A single subdivided line or bar for use over n entire chart is shown only when the chart is of such scale and projection that the scale varies a negligible amount over the chart, usually one of about 1:75,000 or larger. Since 1 minute of latitude is very nearly equal to 1 nautical mile, the latitude scale serves as an approximate graphic scale. On most nautical charts the east and west borders are subdivided to facilitate distance measurements.
On a Mercator chart the scale varies with the
latitude. This is noticeable on a chart covering a relatively large distance in
a north-south direction. On such a chart the border scale near the latitude in
question should be used for measuring distances.
Of the various methods of indicating scale, the
graphical method is normally available in some form on the chart. In addition,
the scale is customarily stated on charts on which the scale does not change
appreciably over the chart. The ways of expressing the scale of a chart are
readily interchangeable. For instance, in a nautical mile there are about
72,913.39 inches. If the natural scale of a chart is 1:80,000, one inch of the
chart represents 80,000 inches of the earth, or a little more than a mile. To
find the exact amount, divide the scale by the number of inches in a mile, or
80,000/72,913.39 = 1.097. Thus, a scale of 1:80,000 is the same as a scale of
1.097 (or approximately 1.1) miles to an inch. Stated another way, there are:
72,913.39/80,000 = 0.911 (approximately 0.9) inch to a mile. Similarly, if the
scale is 60 nautical miles to an inch, the representative fraction is 1:(60 x 72,913.39) = 1:4,374,803.
A chart covering a relatively large area is called a
small-scale chart and one covering a relatively small area is called a
large-scale chart. Since the terms are relative, there is no sharp division
between the two. Thus, a chart of scale 1:100,000 is large scale when compared
with a chart of 1:1,000,000 but small scale when compared with one of 1:25,000.
As scale decreases, the amount of detail which can be
shown decreases also. Cartographers selectively decrease the detail in a process
called generalization when producing small scale charts using large scale
charts as sources. The amount of detail shown depends on several factors, among
them the coverage of the area at larger scales and the intended use of the
chart.
Chart
Classification By Scale
Charts are constructed on many different scales,
ranging from about 1:2,500 to 1:14,000,000. Small-scale charts covering large
areas are used for route planning and for offshore navigation. Charts of larger
scale, covering smaller areas, are used as the vessel approaches land. Several
methods of classifying charts according to scale are used in various nations.
The following classifications of nautical charts are used by the US National
Ocean Service.
Sailing charts are the smallest scale charts used for
planning, fixing position at sea, and for plotting the dead reckoning while
proceeding on a long voyage. The scale is generally smaller than 1:600,000. The
shoreline and topography are generalized and only offshore soundings, the
principal navigational lights, outer buoys, and landmarks visible at
considerable distances are shown.
General charts are intended for coastwise navigation
outside of outlying reefs and shoals. The scales range from about 1:150,000 to
1:600,000.
Coastal charts are intended for inshore coastwise
navigation, for entering or leaving bays and harbours of considerable width,
and for navigating large inland waterways.
The scales range from about 1:50,000 to 1:150,000.
Harbour charts are intended for navigation and
anchorage in harbours and small waterways. The scale is generally larger than
1:50,000.
In the classification system the sailing charts are
incorporated in the general charts classification (smaller than about
1:150,000); those coast charts especially useful for approaching more confined
waters (bays, harbours) are classified as approach charts. There is
considerable overlap in these designations, and the classification of a chart
is best determined by its use and by its relationship to other charts of the
area. The use of insets complicates the placement of charts into rigid
classifications.
Factors
Relating To Accuracy
The accuracy of a chart depends upon the accuracy of
the hydrographic surveys used to compile it and the suitability of its scale
for its intended use.
Estimate the accuracy of a chart’s surveys from the
source notes given in the title of the chart. If the chart is based upon very
old surveys, use it with caution. Many early surveys were inaccurate because of
the technological limitations of the surveyor.
The number of soundings and their spacing indicates
the completeness of the survey. Only a small fraction of the soundings taken in
a thorough survey are shown on the chart, but sparse or unevenly distributed
soundings indicate that the survey was probably not made in detail. Large blank
areas or absence of depth contours generally indicate lack of soundings in the
area.
Operate in an area with sparse sounding data only if
operationally required and then only with the most extreme caution. Run the echo
sounder continuously and operate at a reduced speed. Sparse sounding
information does not necessarily indicate an incomplete survey. Relatively few
soundings are shown when there is a large number of depth contours, or where
the bottom is flat, or gently and evenly sloping. Additional soundings are
shown when they are helpful in indicating the uneven character of a rough
bottom.
Even a detailed survey may fail to locate every rock
or pinnacle. In waters where they might be located, the best method for finding
them is a wire drag survey. Areas that have been dragged may be indicated on
the chart by limiting lines and green or purple tint and a note added to show
the effective depth at which the drag was operated. Changes in bottom contours
are relatively rapid in areas such as entrances to harbors where there are
strong currents or heavy surf. Similarly, there is sometimes a tendency for
dredged channels to shoal, especially if they are surrounded by sand or mud,
and cross currents exist. Charts often contain notes indicating the bottom
contours are known to change rapidly.
The same detail cannot be shown on a small-scale chart
as on a large-scale chart. On small-scale charts, detailed information is
omitted or “generalized” in the areas covered by larger scale charts. The
navigator should use the largest scale chart available for the area in which he
is operating, especially when operating in the vicinity of hazards. Charting
agencies continually evaluate both the detail and the presentation of data
appearing on a chart. Development of a new navigational aid may render previous
charts inadequate. The development of radar, for example, required upgrading
charts, which lacked the detail required for reliable identification of radar
targets.
After receiving a chart, the user is responsible for
keeping it updated. Mariner’s reports of errors, changes, and suggestions are
useful to charting agencies. Even with modern automated data collection
techniques, there is no substitute for on-sight observation of hydrographic
conditions by experienced mariners. This holds true especially in less
frequently travelled areas of the world.
CHARTS:
Preliminary
Steps
Upon receiving a new paper chart, verify its
announcement in the Notice to Mariners and correct it with all applicable
corrections. Read all the chart’s notes; there should
be no question about the meanings of symbols or the units in which depths are
given. Since the latitude and longitude scales differ considerably on various
charts, carefully note those on the chart to be used. Prepare piloting charts
and open ocean transit charts. Place additional information on the chart as
required.
Arcs of circles might be drawn around navigational
lights to indicate the limit of visibility at the height of eye of an observer
on the bridge. Notes regarding other information from the light lists, tide
tables, tidal current tables, and sailing directions might prove helpful.
The preparation of electronic charts for use is
determined by the operator’s manual for the system. If the electronic chart
system in use is not IMO-approved, the navigator is required to maintain a
concurrent plot on paper charts.
Maintaining Paper Charts
A mariner navigating on an uncorrected chart is
courting disaster. The chart’s print date reflects the latest Notice to
Mariners used to update the chart; responsibility for maintaining it after this
date lies with the user. The weekly Notice to Mariners contains information
needed for maintaining charts. Radio broadcasts give advance notice of urgent
corrections. Local Notice to Mariners should be consulted for inshore areas.
The navigator must develop a system to keep track of chart corrections and to
ensure that the chart he is using s updated with the latest correction. A
convenient way of keeping this record is with a chart/Publication Correction Record Card system. Using this system,
the navigator does not immediately update every chart in his portfolio when he
receives the Notice to Mariners. Instead, he constructs a card for every chart
in his portfolio and notes the correction on this card. When the time comes to
use the chart, he pulls the chart and chart’s card, and he makes the indicated
corrections on the chart. This system ensures that every chart is properly
corrected prior to use.
A Summary of
Corrections, containing a cumulative listing of previously published Notice
to Mariners corrections, is published bi-annually.
Thus, to fully correct a chart whose edition date is
several years old, the navigator needs only the Summary of Corrections for that
region and the notices from that Summary forward; he does not need to obtain
notices all the way back to the edition date. The mariner bears the
responsibility for ensuring that his charts are the current edition. The very
fact that a new edition has been prepared indicates that there have been
changes that cannot adequately be shown by hand corrections.
Use And Stowage Of Charts
Use and stow charts carefully. This is especially true
with digital charts contained on electronic media. Keep optical and magnetic
media containing chart data out of the sun, inside dust covers, and away from
magnetic influences.
Placing a disk in an inhospitable environment will
destroy important data. Make permanent corrections to paper charts in ink so
that they will not be inadvertently erased. Pencil in all
other markings so that they can be easily erased without damaging the chart.
Lay out and label tracks on charts of frequently-travelled ports in ink. Draw lines and labels no larger
than necessary. Do not obscure sounding data or other information when labeling
a chart. When a voyage is completed, carefully erase the charts unless there
has been a grounding or collision. In this case, preserve the charts without
change because they will play a critical role in the investigation.
When not in use, stow charts flat in their proper
portfolio. Minimize their folding and properly index them for easy retrieval.
ECDIS
SOLAS -
CHAPTER V: Safety of Navigation
Regulation 20
Nautical publications
All ships shall carry adequate and up-to-date charts,* sailing directions, lists of lights, notices to mariners, tide tables and all other nautical publications necessary for the intended voyage.
*Refer to the Recommendation on performance standards
for electronic chart display and information systems (ECDIS) (resolution A.817
(19), as amended) and resolution MSC.86 (70).
The ECDIS is the only system recognised under
International law, as an acceptable replacement for paper charts.
This is an important legal point. International law
requires that a paper chart be used at all times (SOLAS chapter V, Reg.20),
unless an IMO approved ECDIS is onboard and in use.
Should an accident occur, the authorities will
determine, if one of these system was in use at the time.
Brief understanding of IMO Res.A817 (19)
As per IMO
Resolution A817 (19)
Noting that
the up to date charts required by SOLAS regulation V/20 can be provided and
displayed electronically on board ships by electronic chart display and
information systems (ECDIS), and that the other nautical
publications required by regulation V/20 may also be so provided and displayed.
Recognizing
the need to prepare performance standards for ECDIS in order to ensure the
operational reliability of such equipment, and to ensure that the information
provided and displayed electronically is at least equivalent to that of up to
date charts and, when also provided and displayed, other nautical publications,
and to avoid, as far as practicable, adverse interaction between ECDIS and
other ship borne navigational and communication equipment
ECDIS
should be capable of displaying all chart information necessary for safe and
efficient navigation originated by, and distributed on the authority of,
government authorised hydrographic offices.
Equivalency of electronic navigation charts to paper charts,
ECD1S, with
adequate back up arrangements, may be accepted as complying with the up to date
charts required by regulation V/20 of the 1974 SOLAS Convention.
Emphasising that the data is as reliable as of the date of survey.
As with
paper charts the warnings and caution that are issued with the above holds true
also for ENC.
Meaning
that the government authorised hydrographic office would obviously take all the
care possible to present on a chart (data base) up to date information of the
area covered.
The IMO has devised a training schedule for usage and handling of ECDIS
Prior an
officer is allowed to use and handle the ships ECDIS, the officer has to go an
IMO approved ECDIS course. This is generally a 40-hour course, which includes
theory as well as practical classes on a simulator. However since this is
conducted on a generic model, specific ship ECDIS familiarisation is also a
must. The officer is encouraged to use the ECDIS to become proficient in using
the ECDIS – including updating of charts as well as the back up arrangement in
case of an ECDIS failure.